Monitoring Tailscale clients with Prometheus
Learn how to track Tailscale traffic using Prometheus for real-time insights into your secure network.
Tailscale makes secure networking easy, but how do you monitor its performance? In this guide, we’ll set up Prometheus to collect key Tailscale metrics and gain insights into your mesh VPN connections. Learn how to track bandwidth usage and ensure your network is running smoothly—all with open-source monitoring tools! 🚀
Setting up Prometheus and Grafana is beyond the scope of this post. If you’re interested in setting them up, check out this guide.
Configure Tailscale
Tailscale offers clients metrics which can scraped by Prometheus. These are metrics as the amount of advertised routes in case of a subnet router, throughput for in and outbound packets. Both direct traffic as via the Tailscale DERP relay.
Lets check out the metics by simple running the command below on your tailscale machine. This will display all the metrics ones.
1
tailscale metrics print
1
2
3
4
5
6
7
8
9
10
11
12
13
14
15
16
17
18
19
20
21
22
23
24
25
26
27
28
29
30
31
32
33
34
35
# TYPE tailscaled_advertised_routes gauge
# HELP tailscaled_advertised_routes Number of advertised network routes (e.g. by a subnet router)
tailscaled_advertised_routes 0
# TYPE tailscaled_approved_routes gauge
# HELP tailscaled_approved_routes Number of approved network routes (e.g. by a subnet router)
tailscaled_approved_routes 0
# TYPE tailscaled_health_messages gauge
# HELP tailscaled_health_messages Number of health messages broken down by type.
tailscaled_health_messages{type="warning"} 0
# TYPE tailscaled_inbound_bytes_total counter
# HELP tailscaled_inbound_bytes_total Counts the number of bytes received from other peers
tailscaled_inbound_bytes_total{path="derp"} 1500
tailscaled_inbound_bytes_total{path="direct_ipv4"} 4089680
tailscaled_inbound_bytes_total{path="direct_ipv6"} 0
# TYPE tailscaled_inbound_dropped_packets_total counter
# HELP tailscaled_inbound_dropped_packets_total Counts the number of dropped packets received by the node from other peers
# TYPE tailscaled_inbound_packets_total counter
# HELP tailscaled_inbound_packets_total Counts the number of packets received from other peers
tailscaled_inbound_packets_total{path="derp"} 12
tailscaled_inbound_packets_total{path="direct_ipv4"} 30362
tailscaled_inbound_packets_total{path="direct_ipv6"} 0
# TYPE tailscaled_outbound_bytes_total counter
# HELP tailscaled_outbound_bytes_total Counts the number of bytes sent to other peers
tailscaled_outbound_bytes_total{path="derp"} 5684
tailscaled_outbound_bytes_total{path="direct_ipv4"} 2681236
tailscaled_outbound_bytes_total{path="direct_ipv6"} 0
# TYPE tailscaled_outbound_dropped_packets_total counter
# HELP tailscaled_outbound_dropped_packets_total Counts the number of packets dropped while being sent to other peers
tailscaled_outbound_dropped_packets_total{reason="error"} 0
tailscaled_outbound_dropped_packets_total{reason="multicast"} 12
# TYPE tailscaled_outbound_packets_total counter
# HELP tailscaled_outbound_packets_total Counts the number of packets sent to other peers
tailscaled_outbound_packets_total{path="derp"} 46
tailscaled_outbound_packets_total{path="direct_ipv4"} 27918
tailscaled_outbound_packets_total{path="direct_ipv6"} 0
Run the command below on the tailscale client/machine you want to get the metrics from. To ensure that the metrics are always available for Prometheus to scrape.
1
sudo tailscale set --webclient=true
Now the metrics are available on http://tailscale-ip:5252/metrics. You can verify if it all works by opening in your browser.
Configure Prometheus
For Prometheus to scrape the metrics, add the below configuration to your existing prometheus.yml and restart prometheus. You can adjust the scrape_interval to your liking, and change the targets to your tailscale machines MagicDNS names.
1
2
3
4
5
6
7
8
9
10
11
12
scrape_configs:
  - job_name: 'tailscale'
    scrape_interval: 10s
    static_configs:
      - targets:
          - 'pi5.tail43c135.ts.net:5252'
          - 'pi4.tail43c135.ts.net:5252'
    relabel_configs:
      - source_labels: [__address__]
        regex: '([^:]+):\d+'
        target_label: instance
        replacement: '$1'
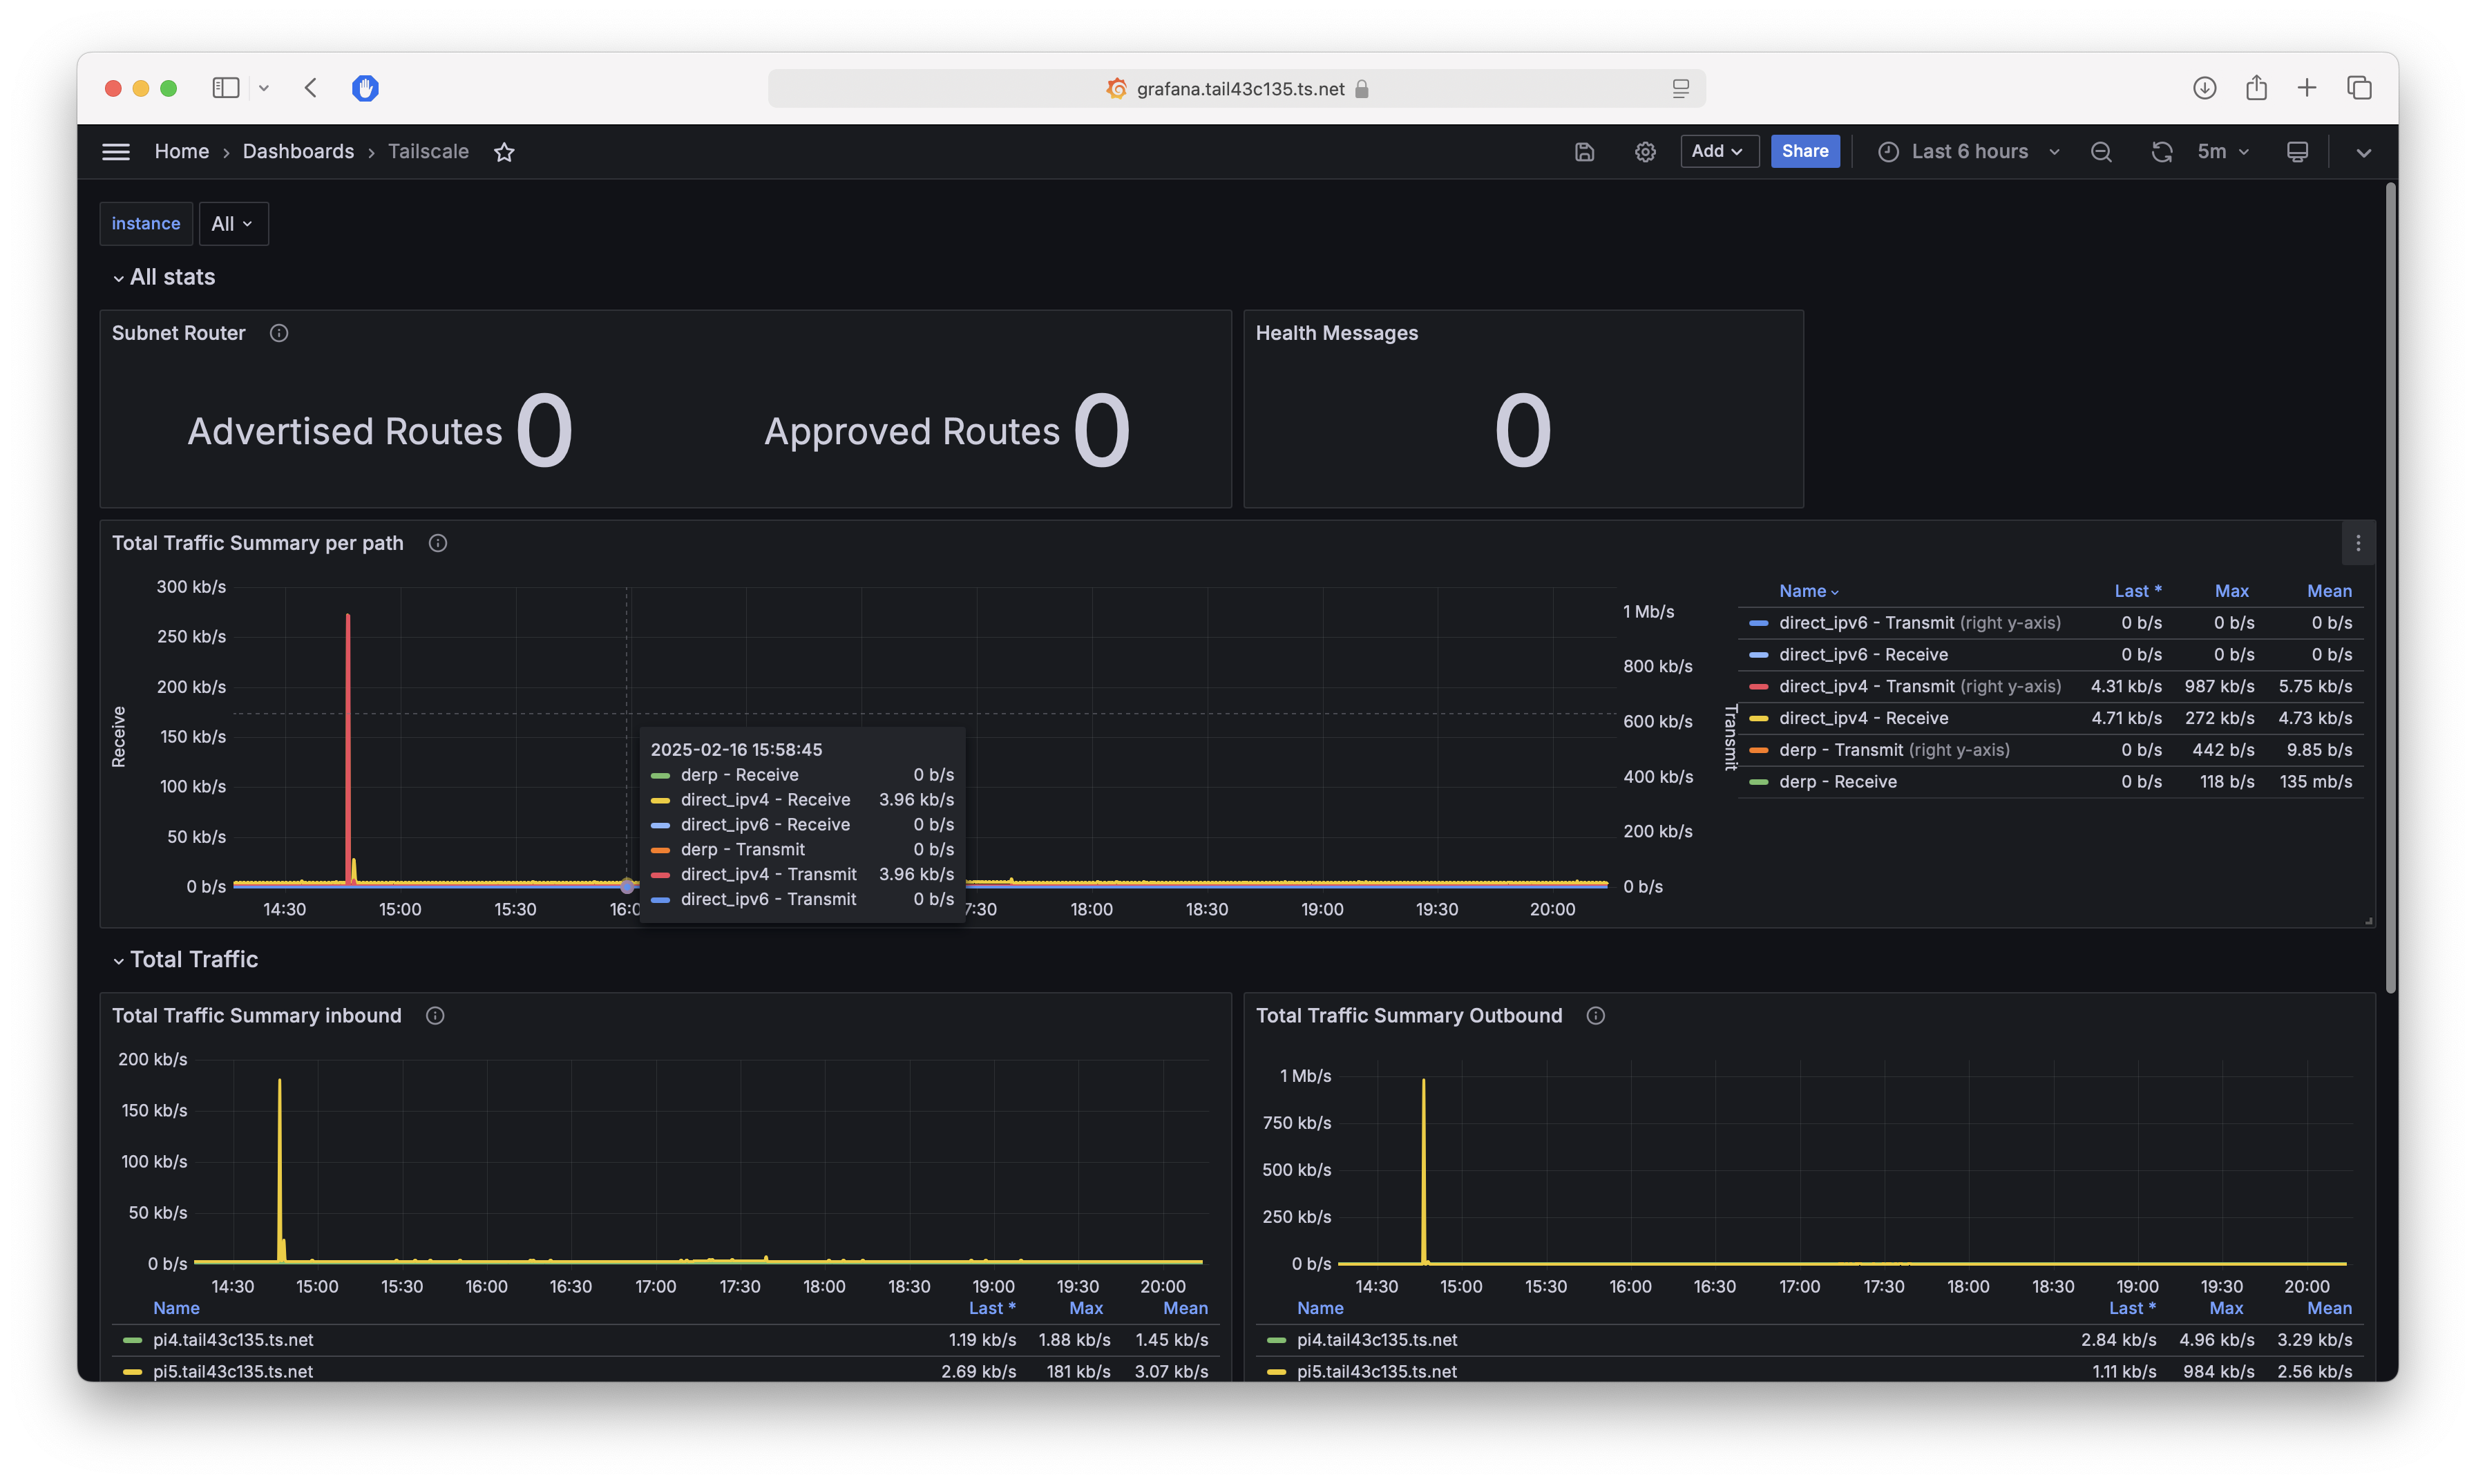
Grafana Dashboard
Now that Prometheus is scraping all the metrics. We can use Grafana to display them. All the tailscale metrics are starting with tailscaled_*. Or you can import this dashboard.