System Monitoring Series Part 1 | Host & Container Monitoring with Prometheus
In Part 1 of the System Monitoring series, learn how to set up performance monitoring for your systems and containers using Prometheus and Grafana.
Monitoring your systems and containers is essential for maintaining a reliable homelab or home server. A popular setup involves Prometheus, Node Exporter, and cAdvisor for collecting metrics, combined with Grafana for creating insightful dashboards.
In this guide, we’ll set up a complete monitoring solution by:
- Configuring Prometheus to scrape metrics from Node Exporter and cAdvisor.
- Using Grafana to visualize the data with intuitive dashboards.
Let’s dive in and build a robust monitoring stack!
Setup Node Exporter & Cadvisor
To organize and store configuration files for monitoring, create dedicated folders for Node Exporter and cAdvisor.
Run the following commands to create the required directories:
1
2
mkdir nodeexporter
mkdir cadvisor
Next, we’ll set up a docker-compose.yml` file in each folder to configure the respective services.
Node Exporter
Open a new docker-compose.yml file for editing:
1
nano nodeexporter/docker-compose.yml
Paste the following content into the file:
1
2
3
4
5
6
7
8
9
10
11
12
13
14
15
services:
  nodeexporter:
    image: prom/node-exporter
    container_name: nodeexporter
    volumes:
      - /proc:/host/proc:ro
      - /sys:/host/sys:ro
      - /:/rootfs:ro
    command:
      - '--path.procfs=/host/proc'
      - '--path.rootfs=/rootfs'
      - '--path.sysfs=/host/sys'
      - '--collector.filesystem.mount-points-exclude=^/(sys|proc|dev|host|etc)($$|/)'
    restart: unless-stopped
    network_mode: host
The
network_mode: hostsetting allows Node Exporter to access the host network interfaces, enabling it to collect networking metrics.
cAdvisor
Open a new docker-compose.yml file for editing:
1
nano cadvisor/docker-compose.yml
Paste the following content into the file:
1
2
3
4
5
6
7
8
9
10
11
12
13
14
15
16
17
18
19
20
21
22
23
24
services:
  cadvisor:
    image: gcr.io/cadvisor/cadvisor
    container_name: cadvisor
    privileged: true
    devices:
      - /dev/kmsg:/dev/kmsg
    environment:
      - TZ=Europe/Amsterdam
    volumes:
      - /:/rootfs:ro
      - /var/run:/var/run:ro
      - /sys:/sys:ro
      - /var/lib/docker:/var/lib/docker:ro
      - /cgroup:/cgroup:ro
    command:
      - '--housekeeping_interval=15s'
      - '--docker_only=true'
    restart: unless-stopped
    networks:
      - backend
networks:
  backend:
    name: backend
Now that we have the configurations in place, we can start Node Exporter and cAdvisor by running the following commands:
1
2
docker compose -f nodeexporter/docker-compose.yml up -d
docker compose -f cadvisor/docker-compose.yml up -d
Setup Prometheus
To collect the metrics from Node Exporter and cAdvisor, we’ll create a dedicated directory for Prometheus to store its configuration and Docker Compose files.
First, create the Prometheus folder:
1
mkdir prometheus
Next, create a docker-compose.yml file for Prometheus:
1
nano prometheus/docker-compose.yml
Add the following configuration to the file:
1
2
3
4
5
6
7
8
9
10
11
12
13
14
15
16
17
18
19
20
21
22
23
24
25
26
27
28
29
services:
  prometheus:
    image: prom/prometheus
    container_name: prometheus
    environment:
      - TZ=Europe/Amsterdam
    volumes:
      - ./prometheus.yml:/etc/prometheus/prometheus.yml:ro
      - prometheus:/prometheus
    command:
      - '--config.file=/etc/prometheus/prometheus.yml'
      - '--storage.tsdb.path=/prometheus'
      - '--web.console.libraries=/etc/prometheus/console_libraries'
      - '--web.console.templates=/etc/prometheus/consoles'
      - '--storage.tsdb.retention.size=100GB'
      - '--web.enable-lifecycle'
    restart: unless-stopped
    expose:
      - 9090
    networks:
      - backend
    extra_hosts:
      - "host.docker.internal:host-gateway"
networks:
  backend:
    name: backend
volumes:
    prometheus:
      name: prometheus
Prometheus requires a configuration file to define which services to scrape for metrics. Create the configuration file:
1
nano prometheus/prometheus.yml
Add the following configuration to the file:
1
2
3
4
5
6
7
8
9
10
11
12
13
14
15
16
17
18
19
20
global:
  scrape_interval:     15s
  evaluation_interval: 15s
scrape_configs:
  - job_name: 'cadvisor'
    scrape_interval: 10s
    static_configs:
      - targets: ['cadvisor:8080']
  - job_name: 'prometheus'
    scrape_interval: 10s
    static_configs:
      - targets: ['localhost:9090']
  - job_name: 'nodeexporter'
    scrape_interval: 10s
    static_configs:
      - targets: ['hostip:9100']
    metric_relabel_configs:
      - source_labels: [nodename]
        target_label: "instance"
        action: "replace"
Since Node Exporter is using the host network, you need to replace
hostipwith your actual host IP address. Themetric_relabel_configswill help in relabeling thehostip:9100to the actual hostname, making it easier to identify.
Now that you have configured Prometheus, you can start it with the following command:
1
docker compose -f prometheus/docker-compose.yml up -d
This command starts the Prometheus container, which will begin collecting metrics from both Node Exporter and cAdvisor, providing comprehensive monitoring for your systems and containers.
Setup Grafana
To finalize your monitoring setup, we’ll create a directory for Grafana to store its Docker Compose and configuration files.
First, create the Grafana folder:
1
mkdir grafana
Next, create a docker-compose.yml file for Grafana:
1
nano grafana/docker-compose.yml
Add the following configuration to the file:
1
2
3
4
5
6
7
8
9
10
11
12
13
14
15
16
17
18
19
services:
  grafana:
    image: grafana/grafana
    container_name: grafana
    environment:
      - TZ=Europe/Amsterdam
    volumes:
      - grafana_data:/var/lib/grafana
    restart: unless-stopped
    ports:
      - 3000:3000
    networks:
      - backend
networks:
  backend:
    name: backend
volumes:
    grafana_data:
      name: grafana_data
Now you can start Grafana by running:
1
docker compose -f grafana/docker-compose.yml up -d
Once Grafana is running, open your browser and navigate to: http://
- Default login credentials:
- Username: admin
- Password: admin
Datasource
To visualize the data collected by Prometheus, you need to add it as a data source in Grafana:
- Click Connections in the left-side menu.
- Search for Prometheus
- Click Add new Datasource
- Enter the name prometheus
- Fill in the Prometheus server URL
http://prometheus:9090
Dashboards
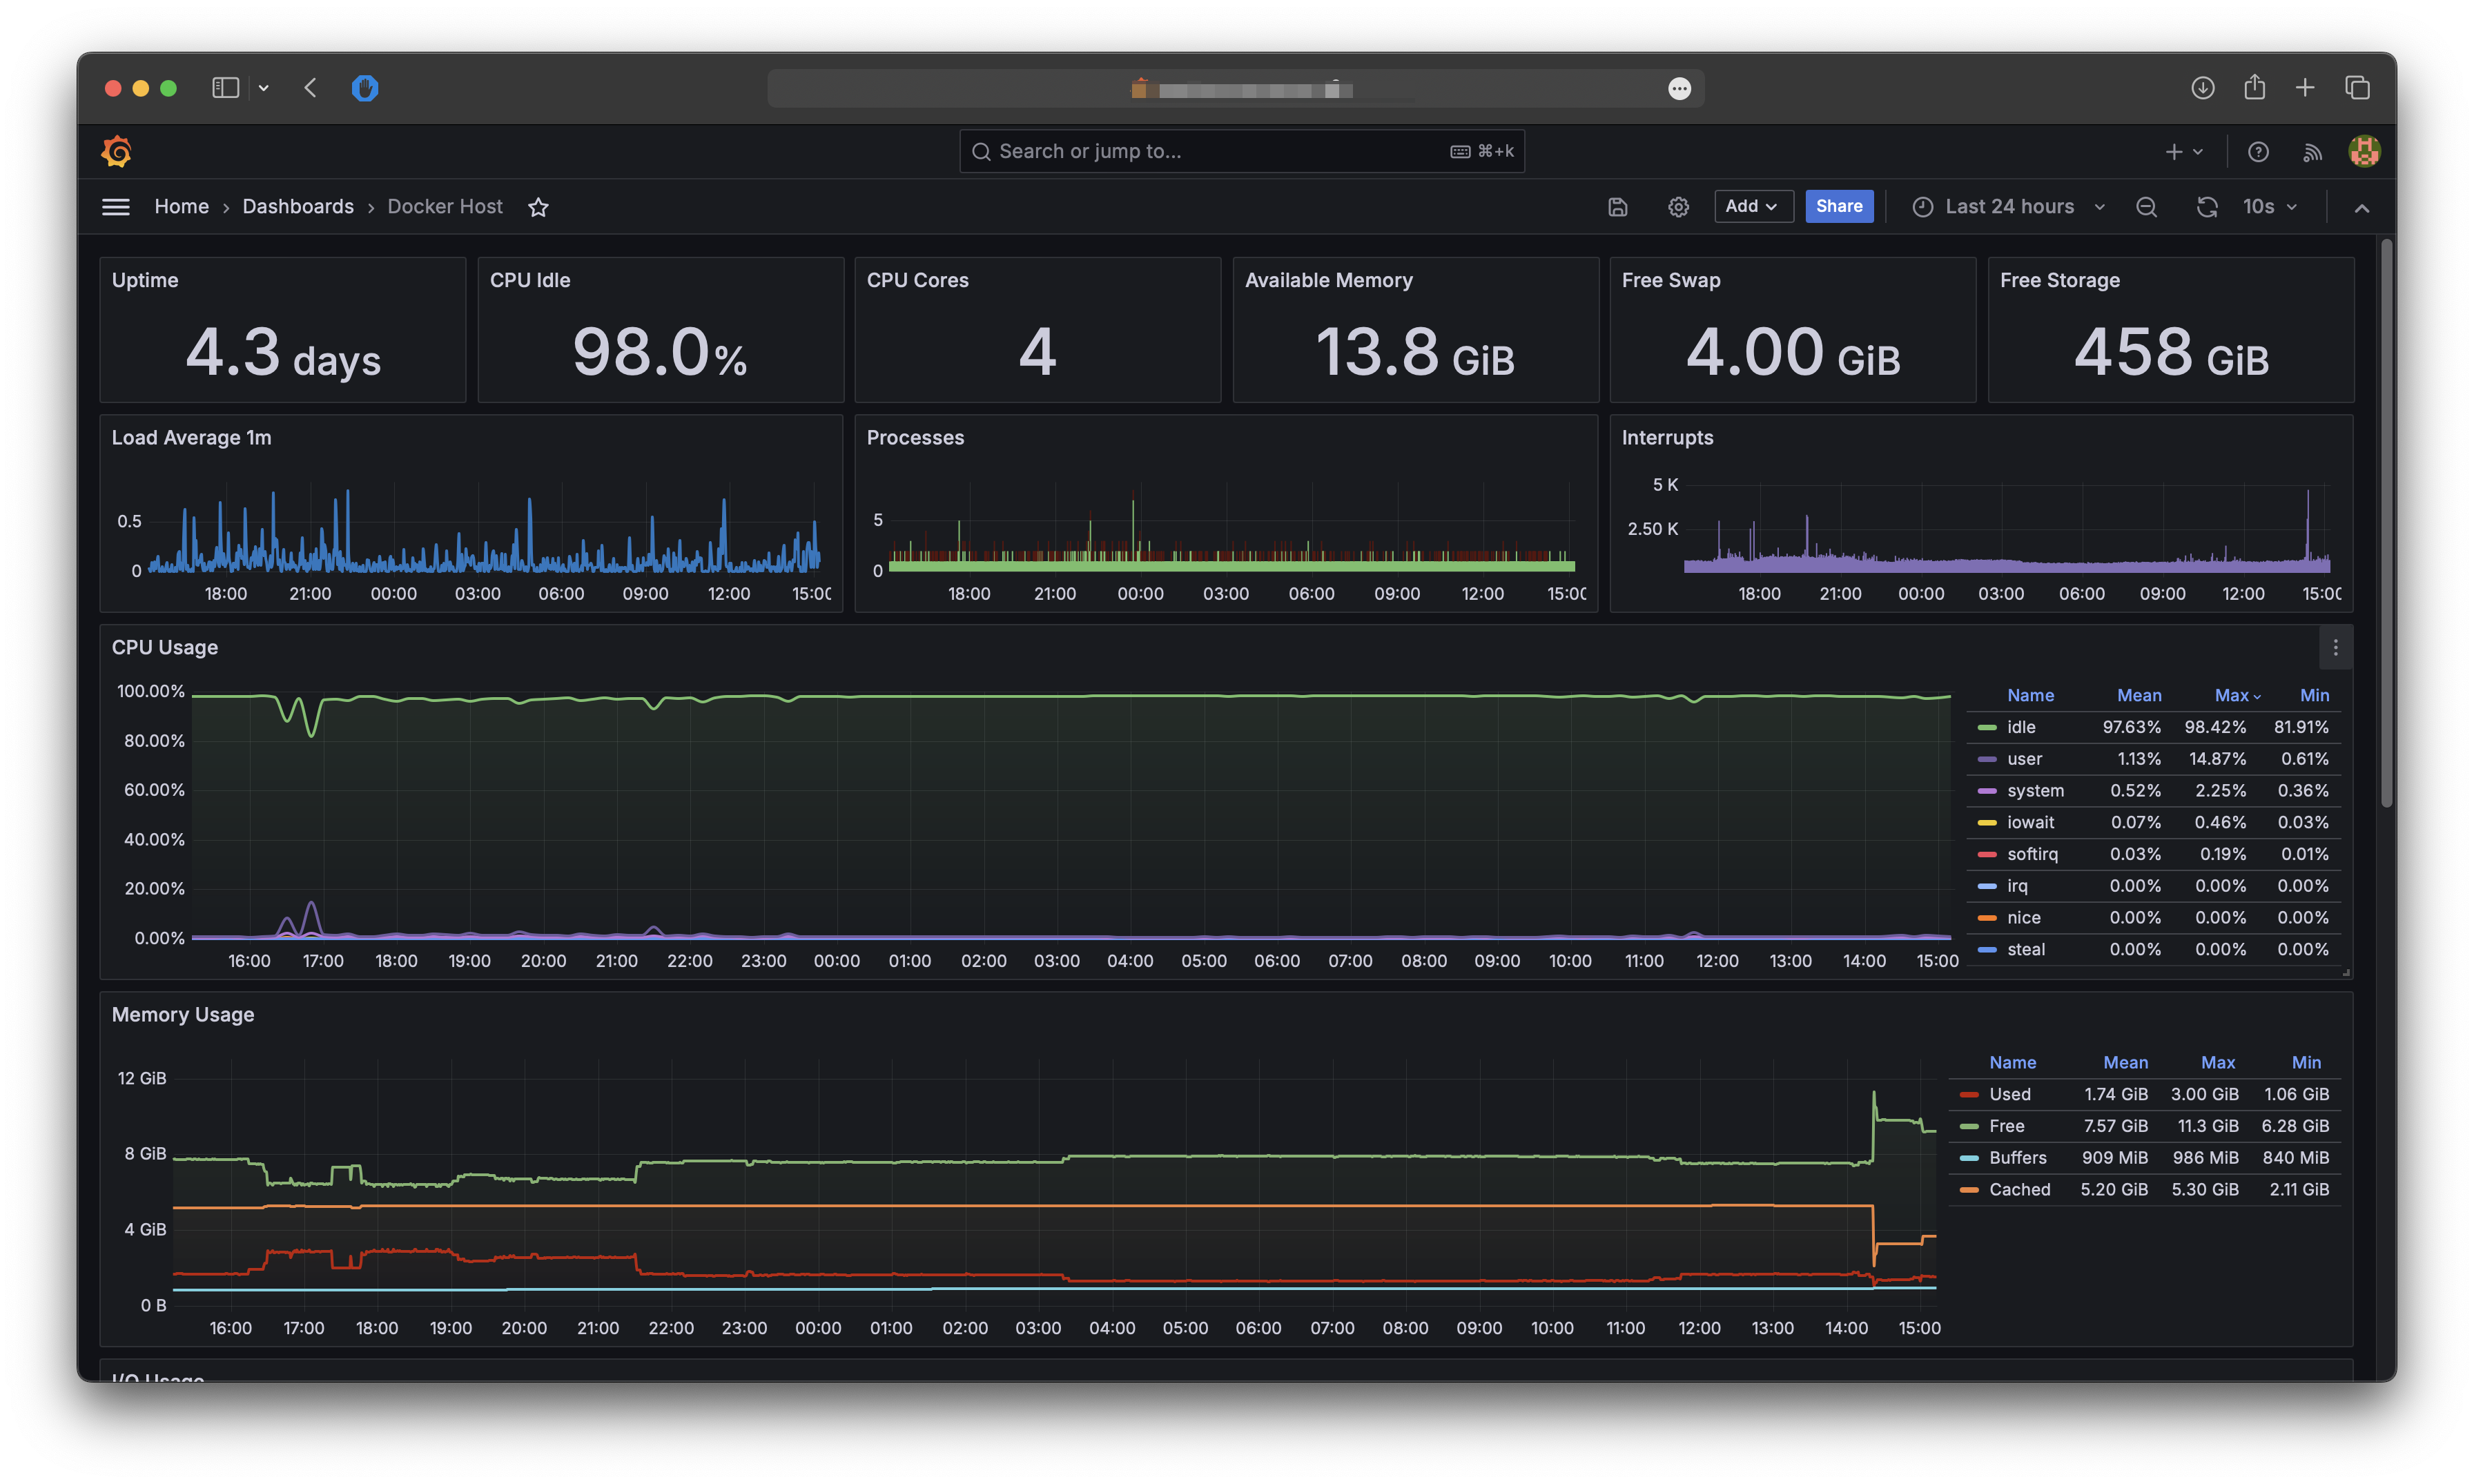
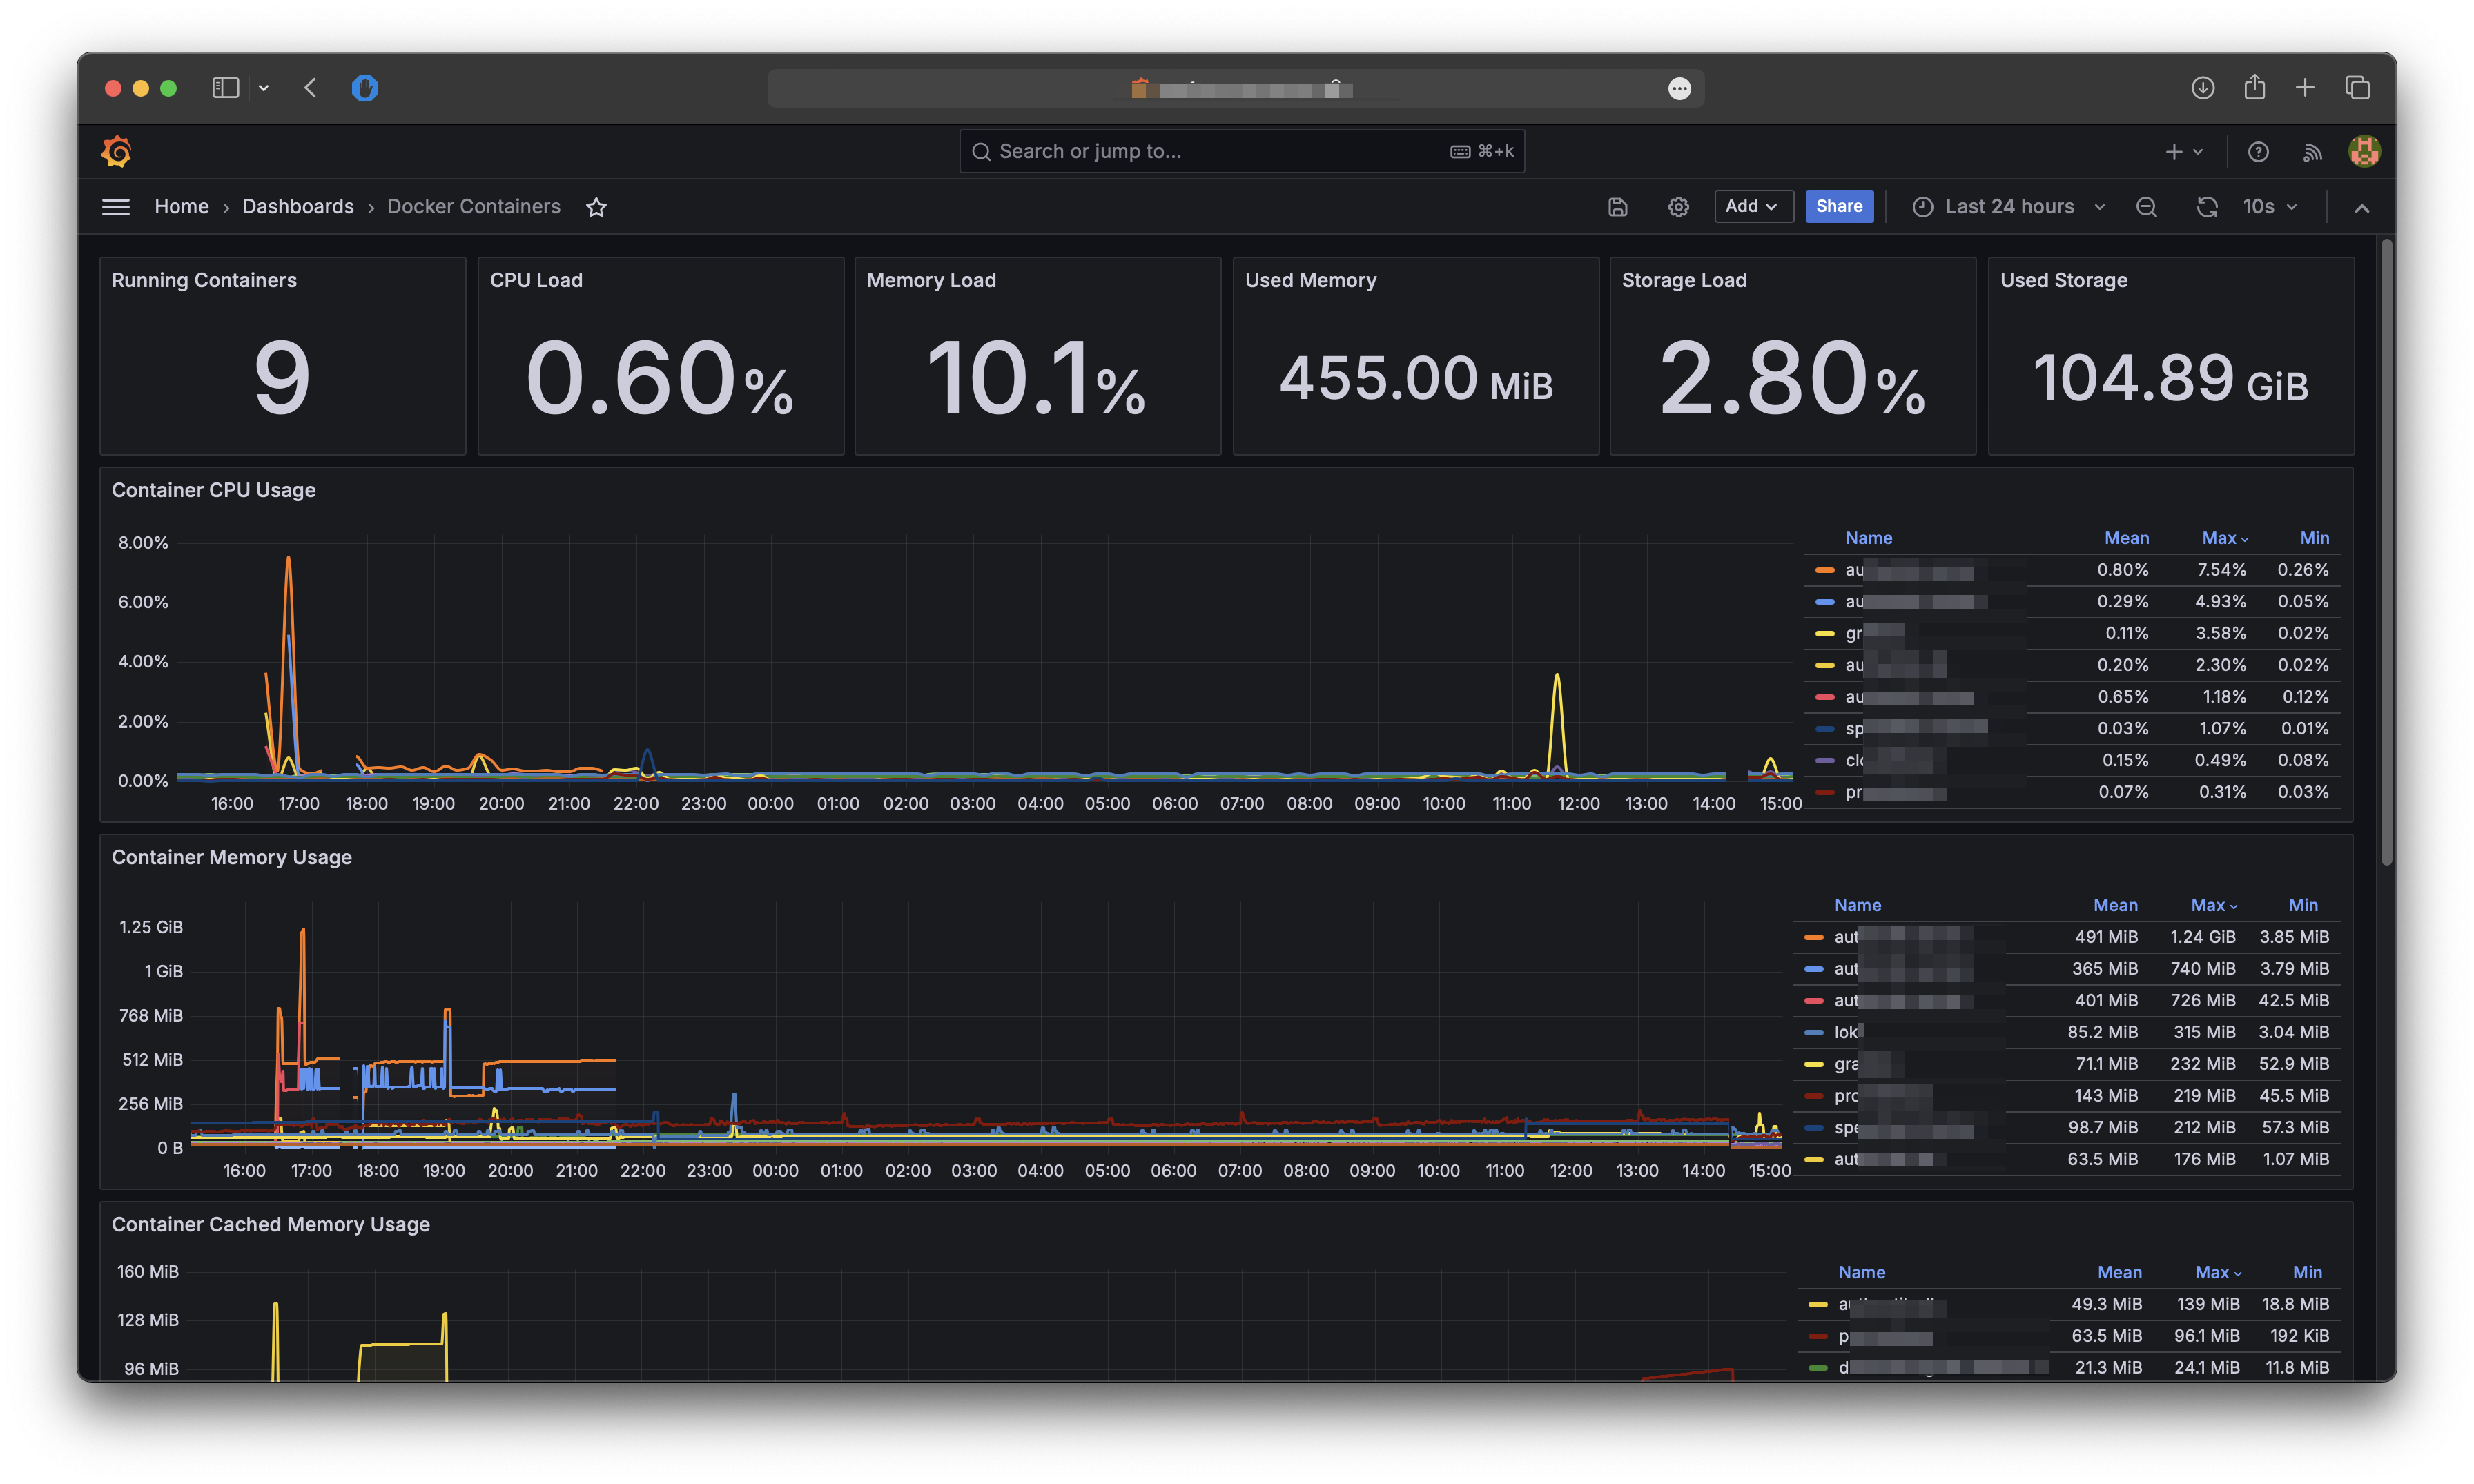
To see all the metrics we need to dashboards. You can make your own dashboards or use mine as a starter:
Conclusion
Congratulations! You have successfully set up host and container monitoring with Prometheus and Grafana. Your monitoring system is now capable of visualizing the metrics from your applications and self-hosting.


